Technically, the 2-hour chart indicators moved sharply higher in the bullish territory.
Ether Price Weekly Analysis
The past two sessions saw an increase in volatility, resulting in swing moves in ETH/USD. The pair formed a support base near the $195.00 level and started a solid upward move above the $200.00, $203.00, $210.00 and $220.00 resistances.
ETH/BTC remained confined in a tiny range above the 0.0310BTC support. It seems like the pair is preparing for the next break either above 0.0320BTC or below 0.0310BTC.
 Starting with the 2-hour chart of ETH/USD, the pair surged higher and broke an ascending channel, with resistance at $204.00. More importantly, there was a break above the key resistance at $203.00.
It opened the doors for more gains and the price spiked above the $210.00 resistance. Ether’s price traded above the $220.00 resistance and tested the next important hurdle at $230.00. Sellers successfully defended the $230.00-232.00 resistance, resulting in a fresh downward move.
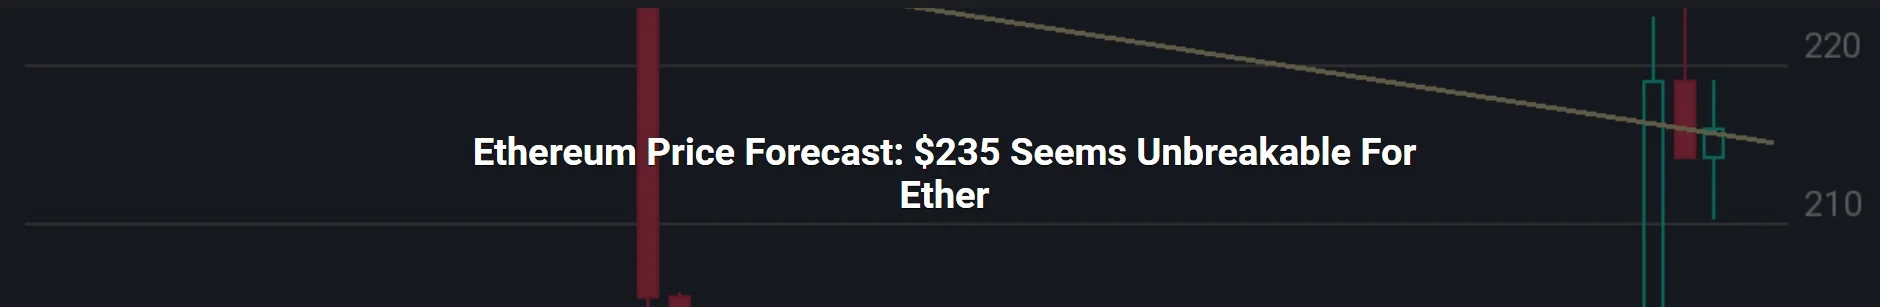
The price declined and traded below the $220.00 support and the 38.2 percent Fibonacci retracement level of the recent upside from the $187.00 low to $232.25 high. At the outset, the price is attempting close above a key bearish trendline at $214.00 on the 2-hour chart.
 The 30-minute chart of ETH/USD indicates that the price is forming a short-term breakout pattern with resistance at $215.00 and support near $210.00. Should Ether settle above the $214.00-215.00 resistance, there could be a fresh upward move toward the $225.00 level in the coming sessions.
On the flip side, if the price breaks the $210.00 support and the 50 percent Fibonacci retracement level of the recent upside, it will most likely revisit the $203.00 support (the previous resistance).