Technically, the 6-hour chart indicators are accelerating losses in the bearish territory.
Ether Price Analysis
The past few sessions were very bearish for ETH/USD as the pair failed to break the $115.00 and $120.00 resistance levels. The pair declined and settled below the $110.00 support area.
ETH/USD also started a fresh decline below the 0.0285BTC support. The pair traded toward the 0.0280BTC support and is currently at a risk of more losses.
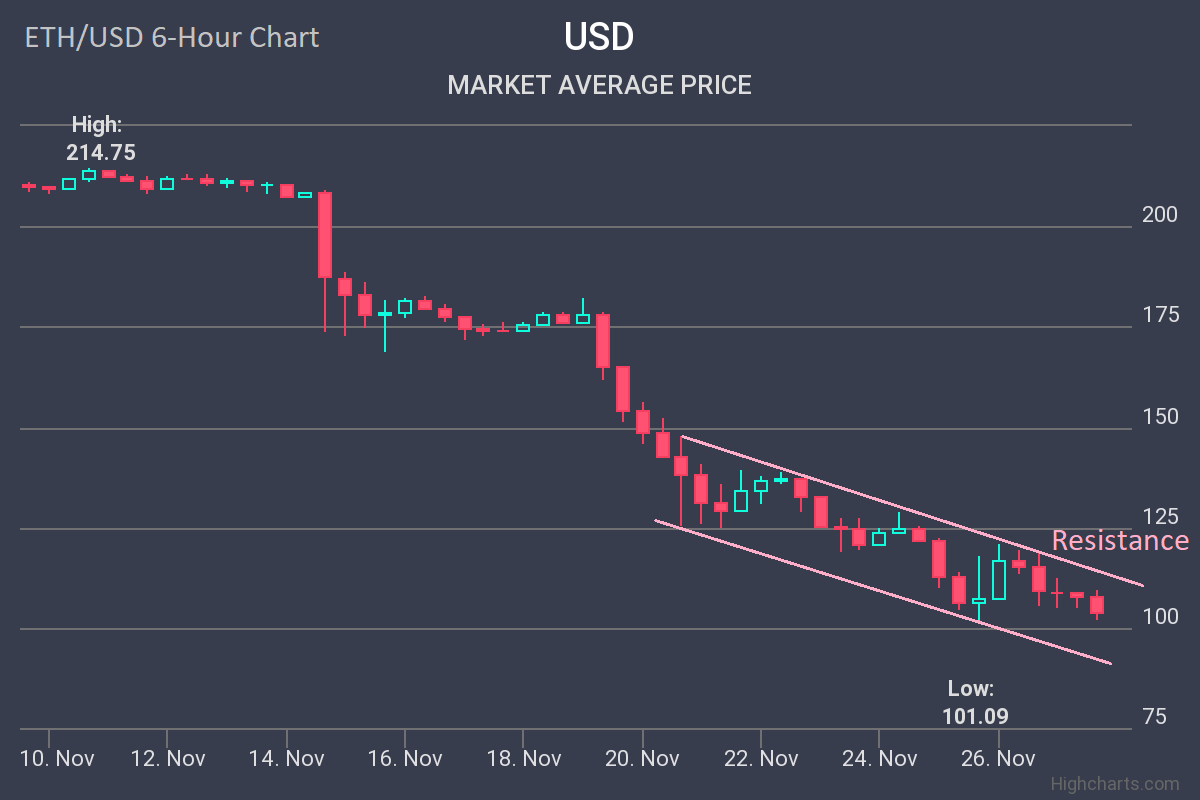
Looking at the 6-hour chart of ETH/USD, the pair is clearly in a significant downtrend from the $140.00 swing high. The pair declined heavily and settled below the $130.00, $120.00, and $110.00 support levels.
More importantly, the price is following a major declining channel, with resistance at $112.00 on the same chart. On the downside, an initial support is near $101.00 followed by $100.00, below which Ether could tumble toward the $92.00 level.
To rebound with a bullish angle, the price must break the $112.00, $115.00, and $120.00 resistance levels. Dropping down to the 2-hour chart of ETH/USD, the pair recently failed to break the $120.00 resistance (the previous support).
 It cleared the path for a fresh decline, and the price traded below $110.00 and $108.00. At the outset, the price is trading above the $101.00-102.00 support area, below which there is a risk of a sharp decline.
Overall, Ether’s price is under a lot of bearish pressure below the $110.00 and $120.00 resistance levels. Should buyers fail to push the price above $120.00 soon, sellers are likely to push the price below $100.00 in the coming sessions.